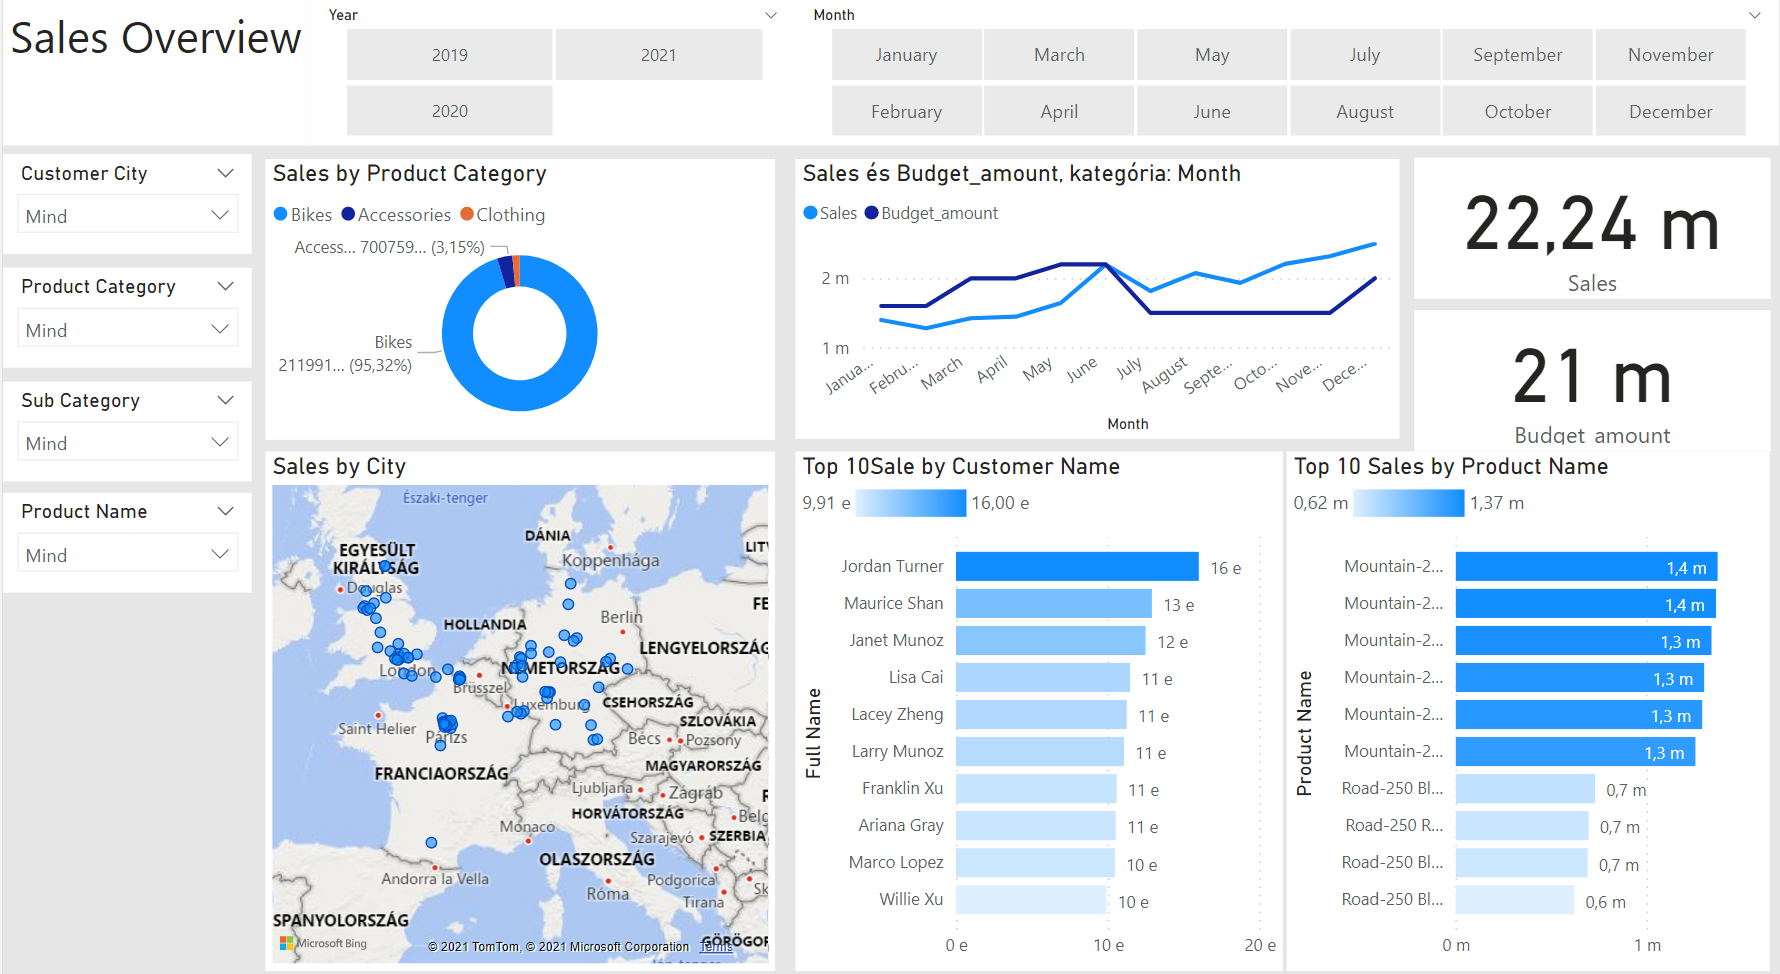
Built in response to a sales manager’s request for a high-level overview of internet sales performance — what products were sold, to which clients, and how actual results compared against budget targets.
Dashboard

Data Model
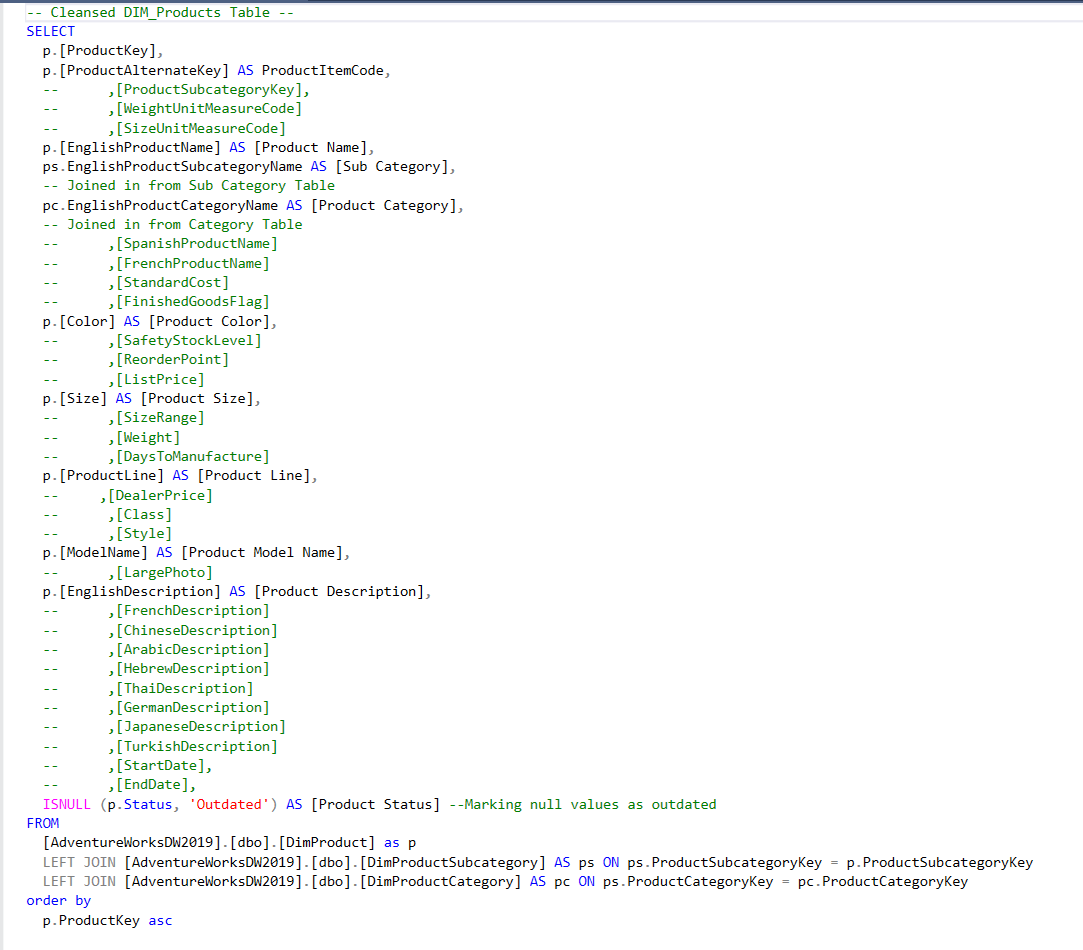
SQL Transformation
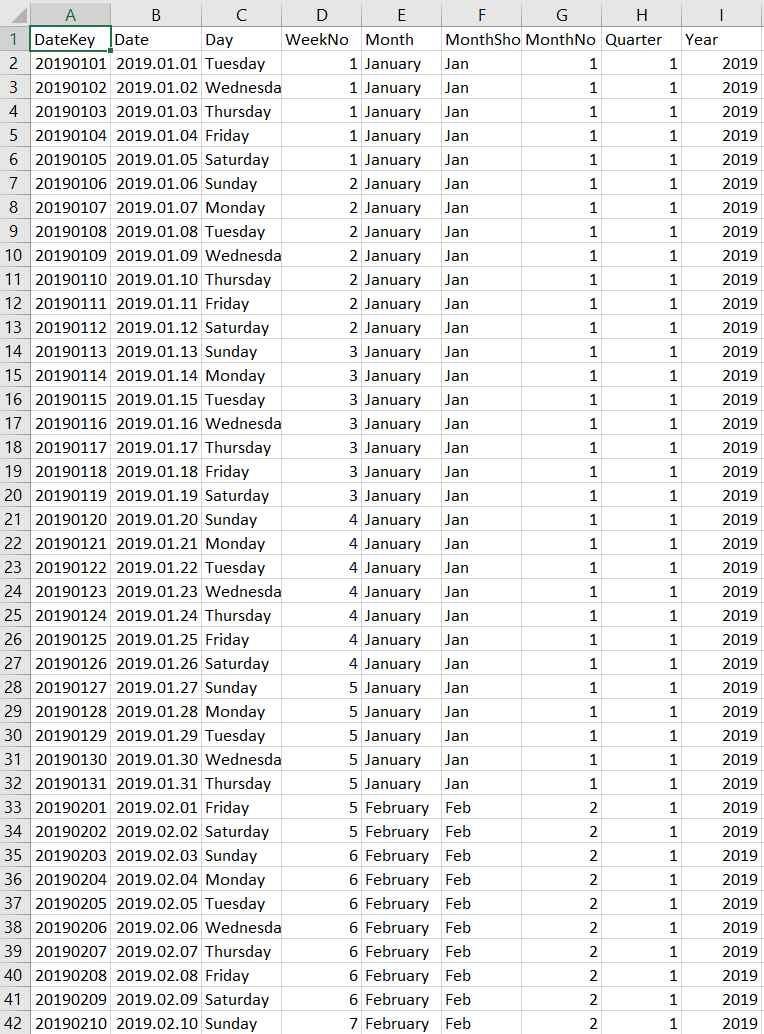
Source Data
What it does
- Filters sales performance by customer and product across time
- Compares actual sales figures against budgeted targets
- Enables sales reps and leadership to drill into their own accounts
- Tracks trends across 2019 onwards using cleansed dimensional data
Tech Stack
| Layer | Technology |
|---|---|
| Data source | AdventureWorksDW2019 (SQL Server) |
| Transformation | SQL (joins, filters, null handling) |
| Budget data | Excel |
| Visualisation | Power BI |
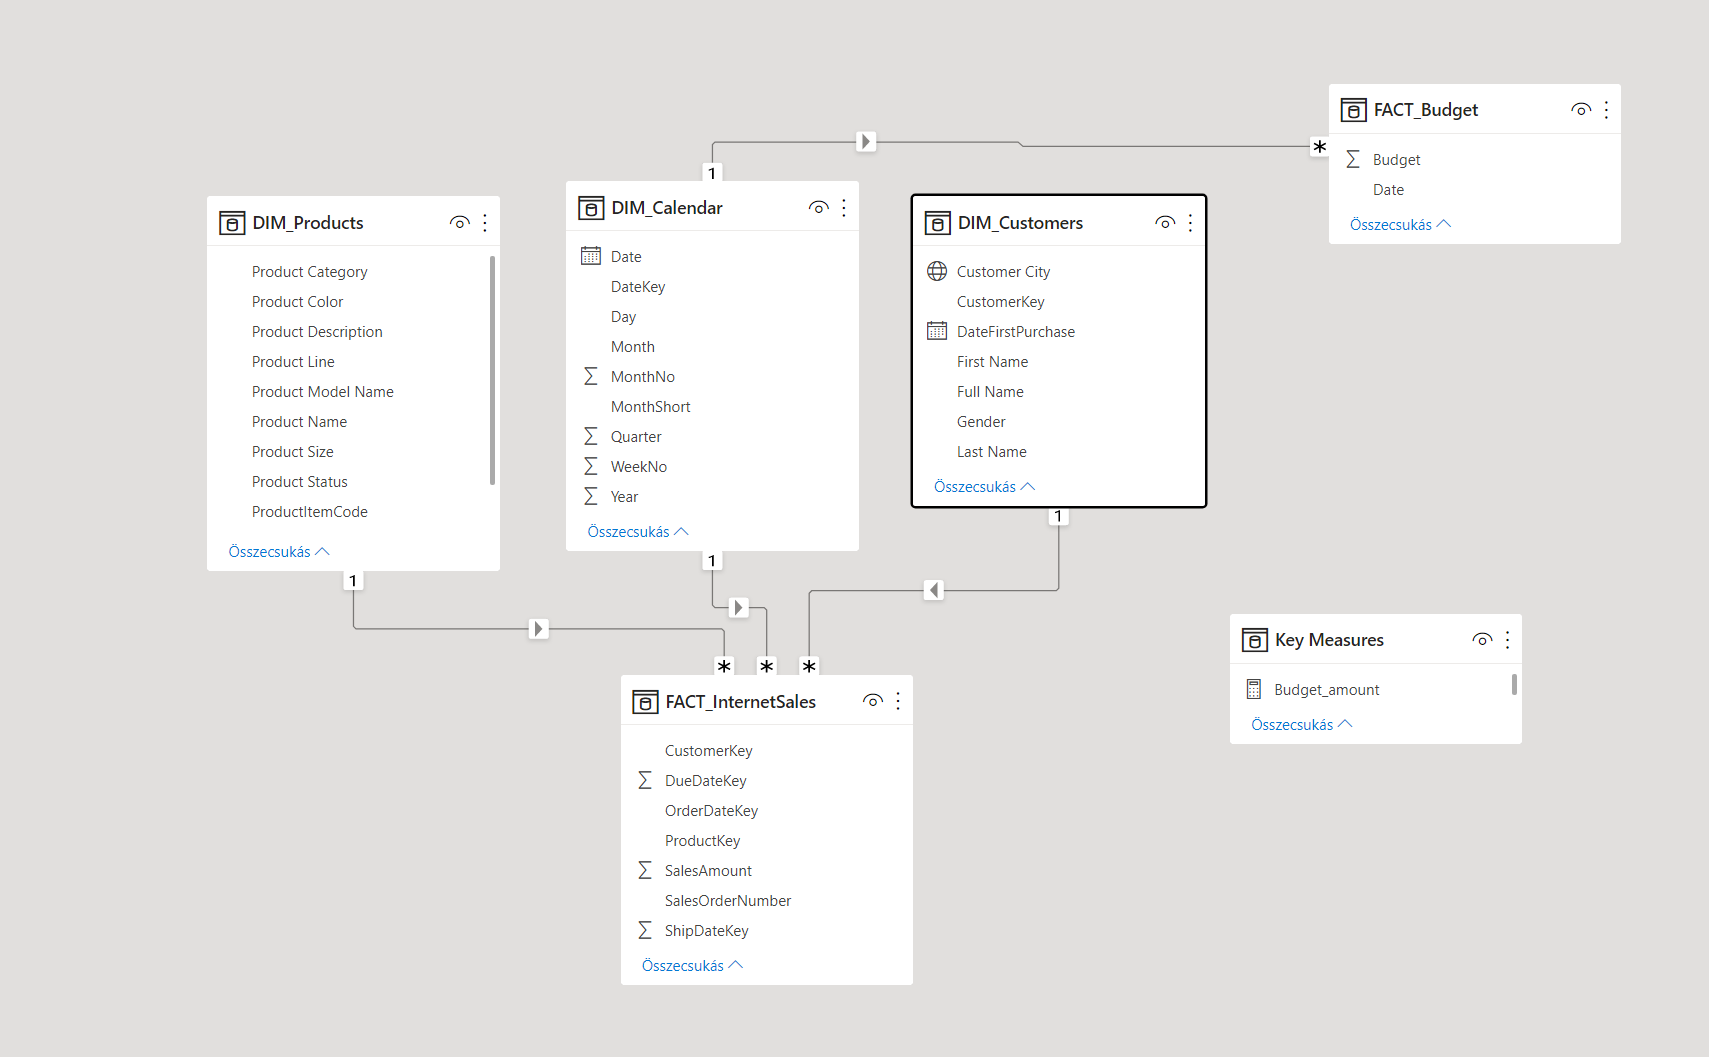
Data Model
Four SQL-transformed tables feeding the dashboard:
- DIM_Date — temporal dimension, filtered from 2019 forward
- DIM_Customer — customer demographics and purchase history
- DIM_Products — product catalogue with categories and attributes
- FACT_InternetSales — transaction records with sales amounts
Each table was cleaned in SQL before import: field selection, multi-table joins, null handling, and date filtering.
Key Skills Demonstrated
- Writing multi-join SQL queries against a relational data warehouse
- Building a proper star schema data model in Power BI
- Designing an executive-facing dashboard with budget comparison
- Connecting Excel budget files to a SQL-sourced data model