A portfolio project visualising historical summer Olympic Games data, enabling users to explore how countries have performed across different eras — with drill-down into individual athletes and events.
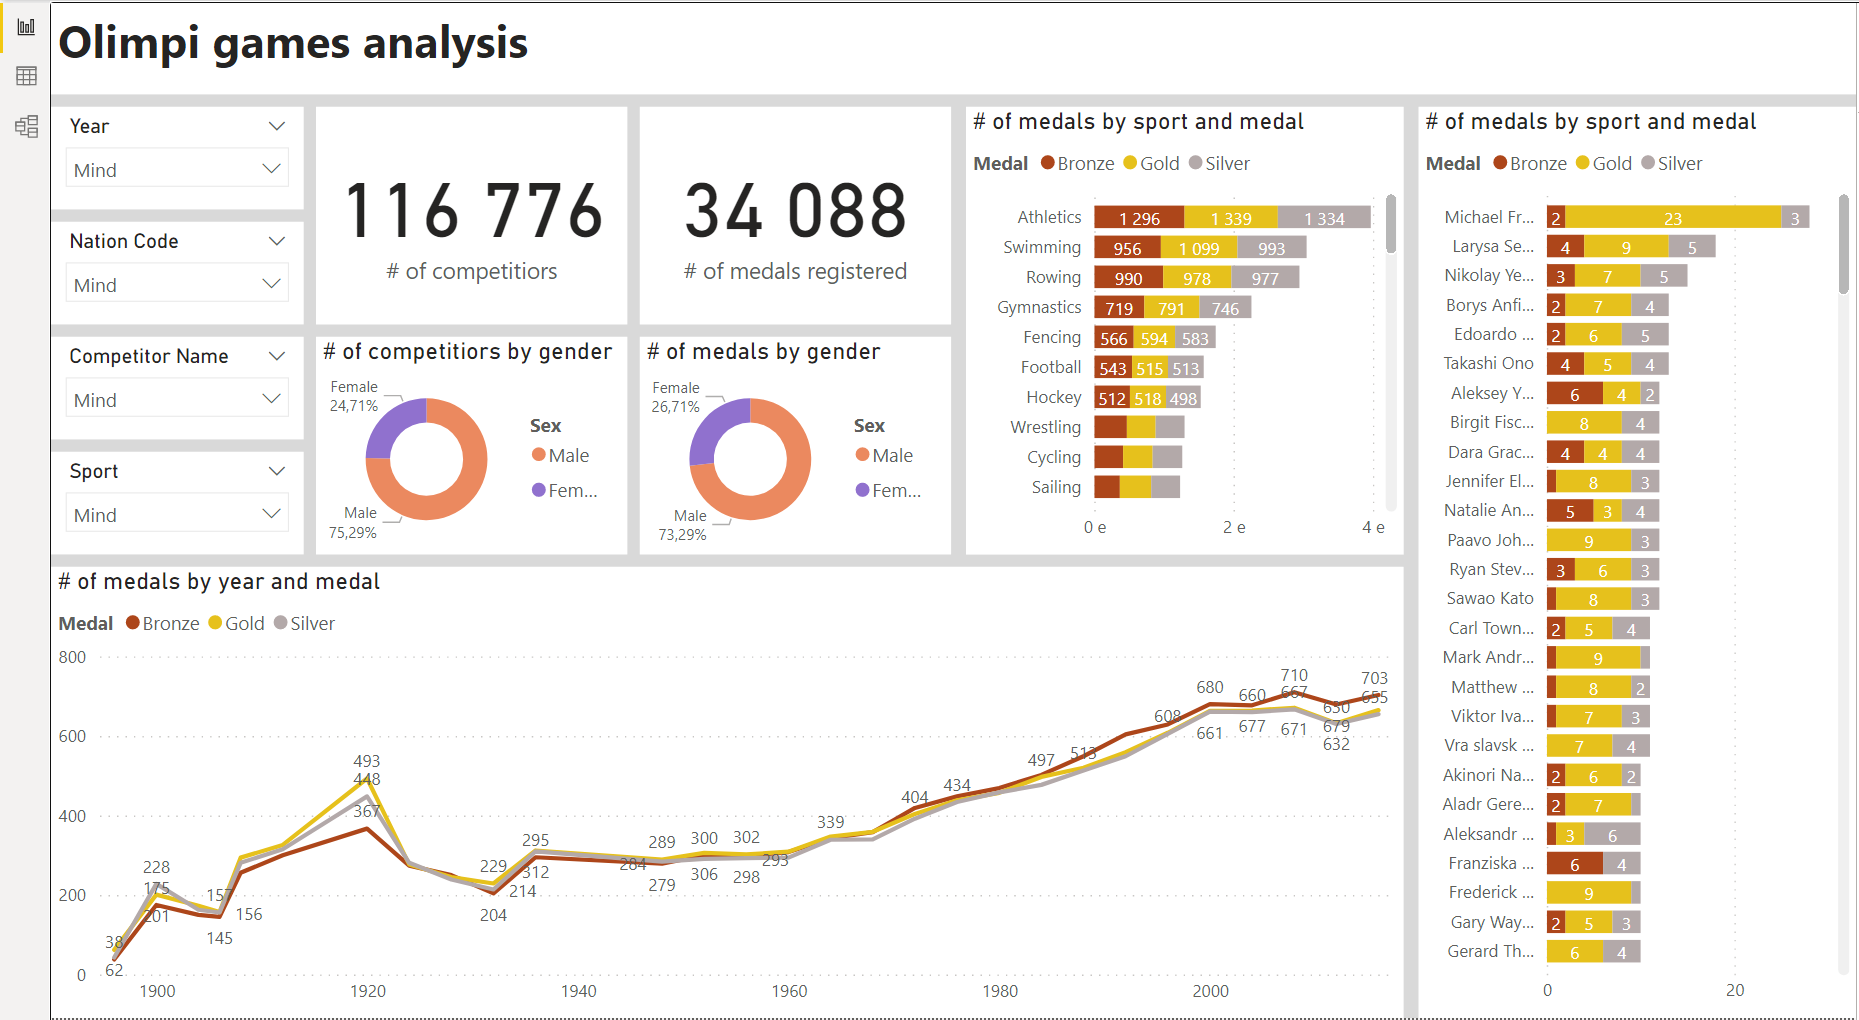
Dashboard

Data Model

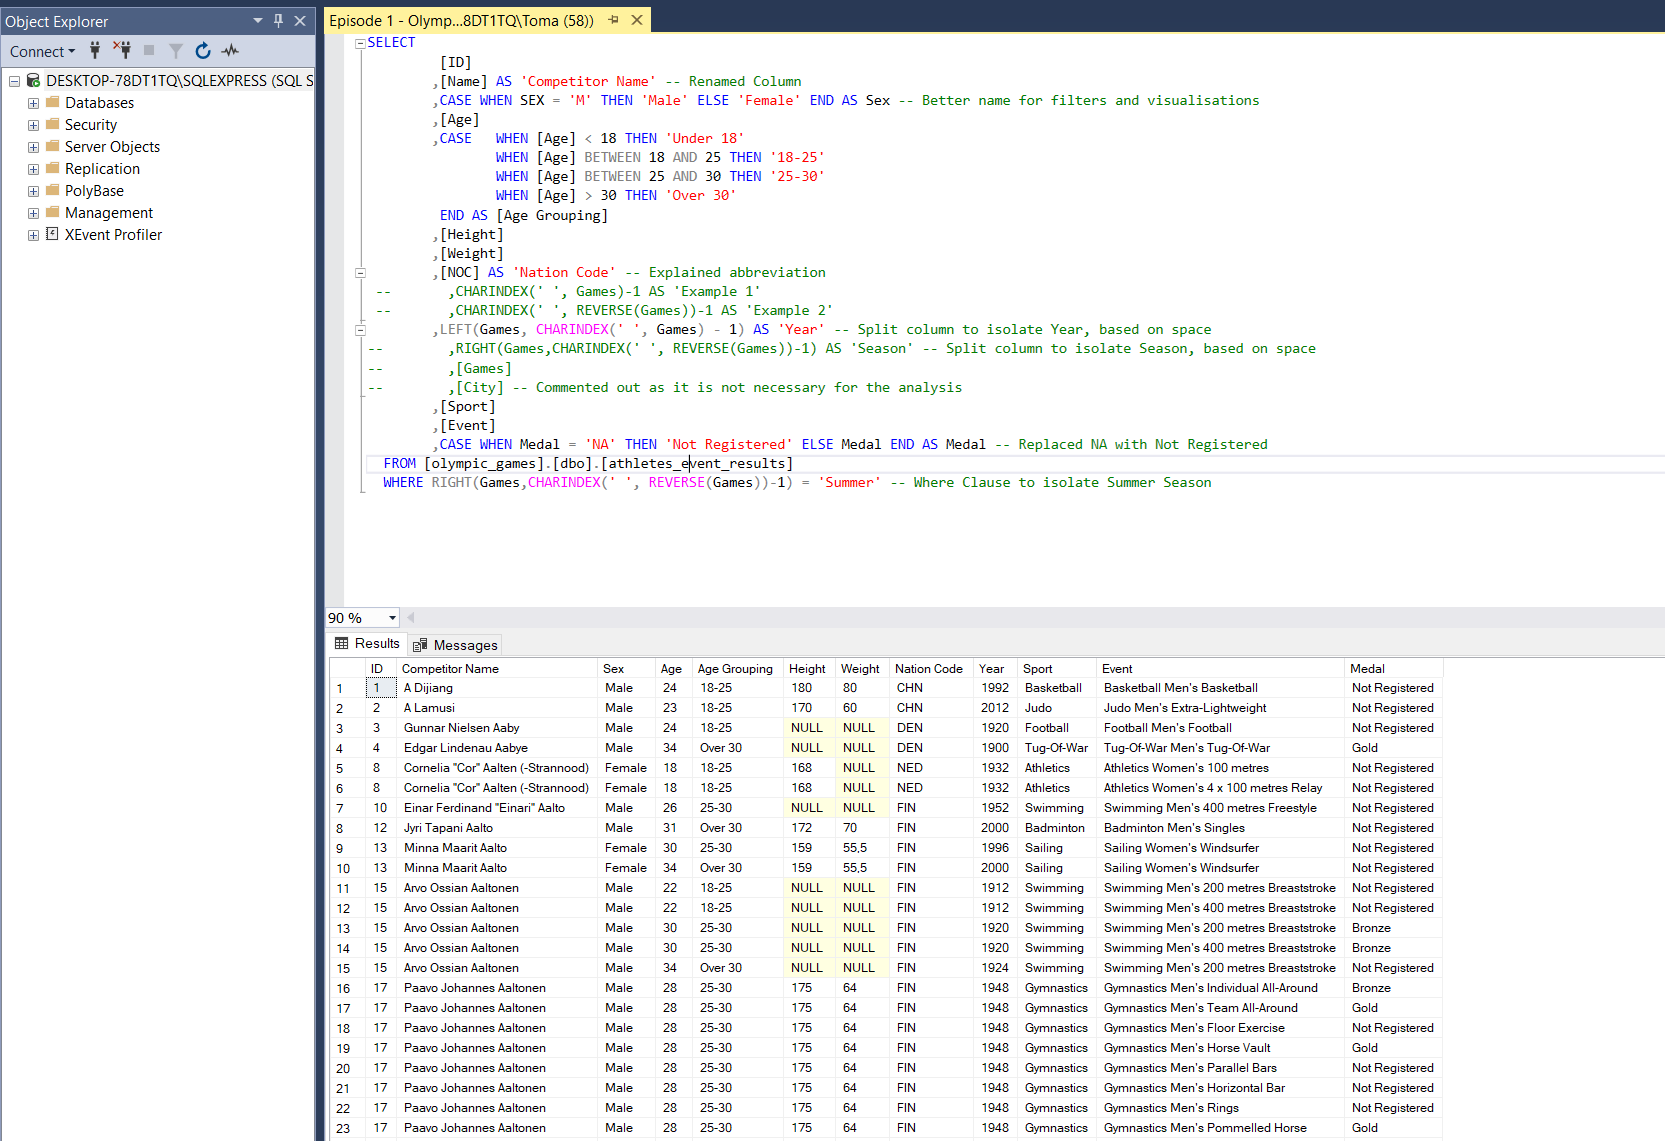
SQL Transformation
What it does
- Shows medal counts (Gold, Silver, Bronze) by country over time
- Filters by nation for comparative country analysis
- Breaks down competitors by age group (Under 18, 18–25, 25–30, Over 30)
- Supports athlete-level drill-through from country summary views
Tech Stack
| Layer | Technology |
|---|---|
| Data source | Olympic athlete event results (SQL database) |
| Transformation | SQL Server |
| Calculations | DAX |
| Visualisation | Power BI |
Data & Methodology
The raw dataset contained competitor details (name, age, height, weight, nation code) and event data (sport, event type, medals earned).
SQL transformations applied:
- Filtered to summer games only
- Converted sex abbreviations (
M/F) toMale/Female - Bucketed ages into defined groups
- Split year out of the game name field into a separate column
The cleaned data was loaded as a single denormalized table into Power BI for simplified modelling.
DAX Measures
- Competitor count — distinct athlete IDs
- Total medal records — all medal entries
- Registered medals — filtered count for Gold, Silver, Bronze only
Key Skills Demonstrated
- SQL data transformation and feature engineering on a real historical dataset
- Designing a filterable country-comparison dashboard in Power BI
- DAX measures for distinct counts and conditional filtering
- Translating a business question (“how have countries performed?”) into a data model and dashboard