A data analysis project investigating which factors most strongly predict a movie’s gross box office earnings, using Python and the scientific stack in a Jupyter Notebook.
Key Finding
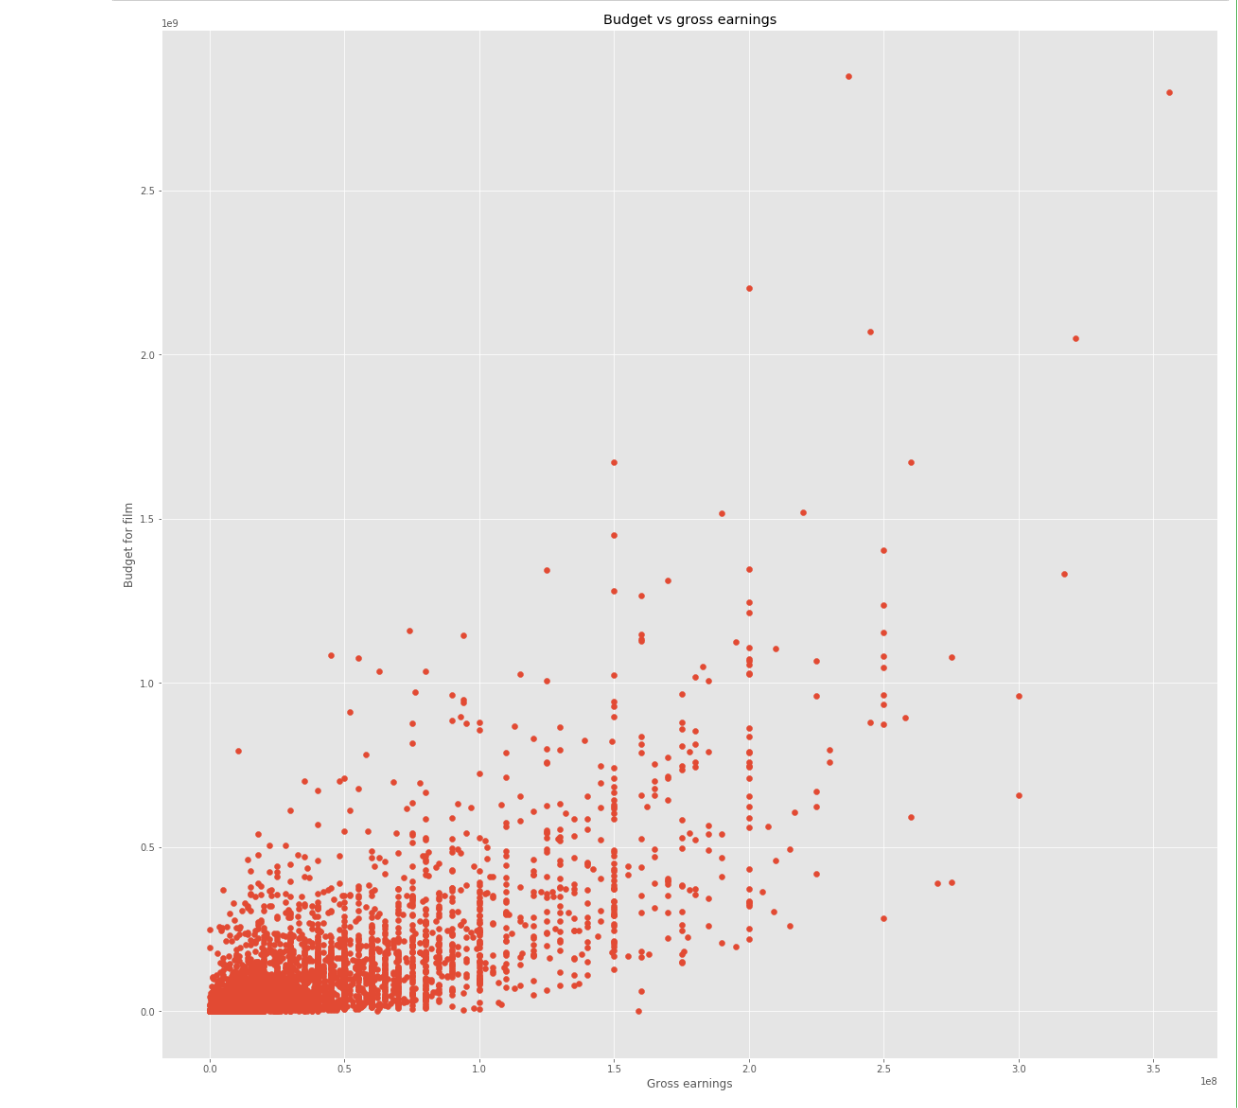
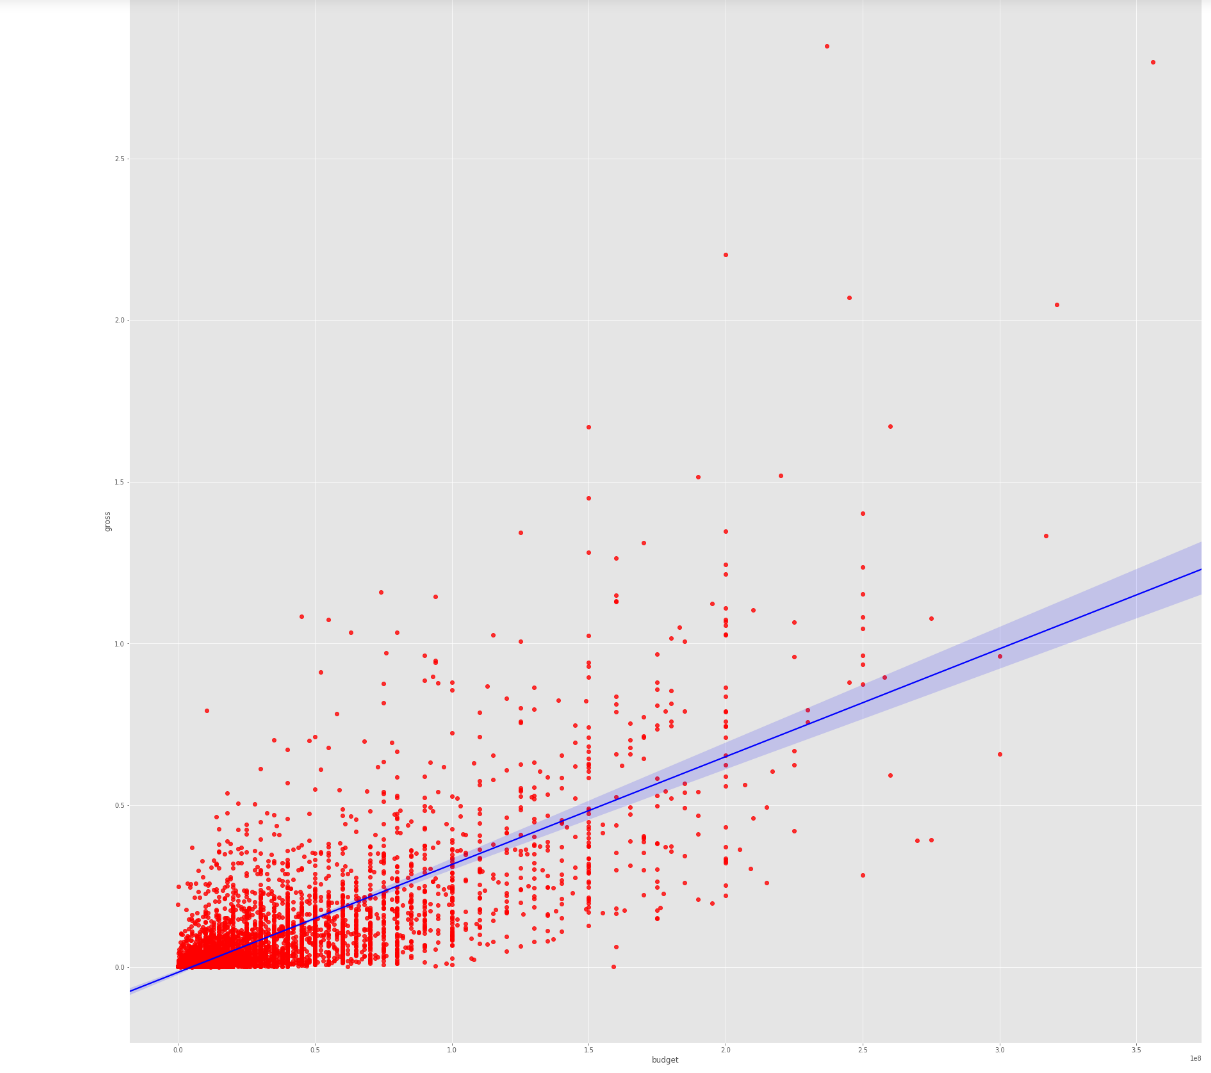
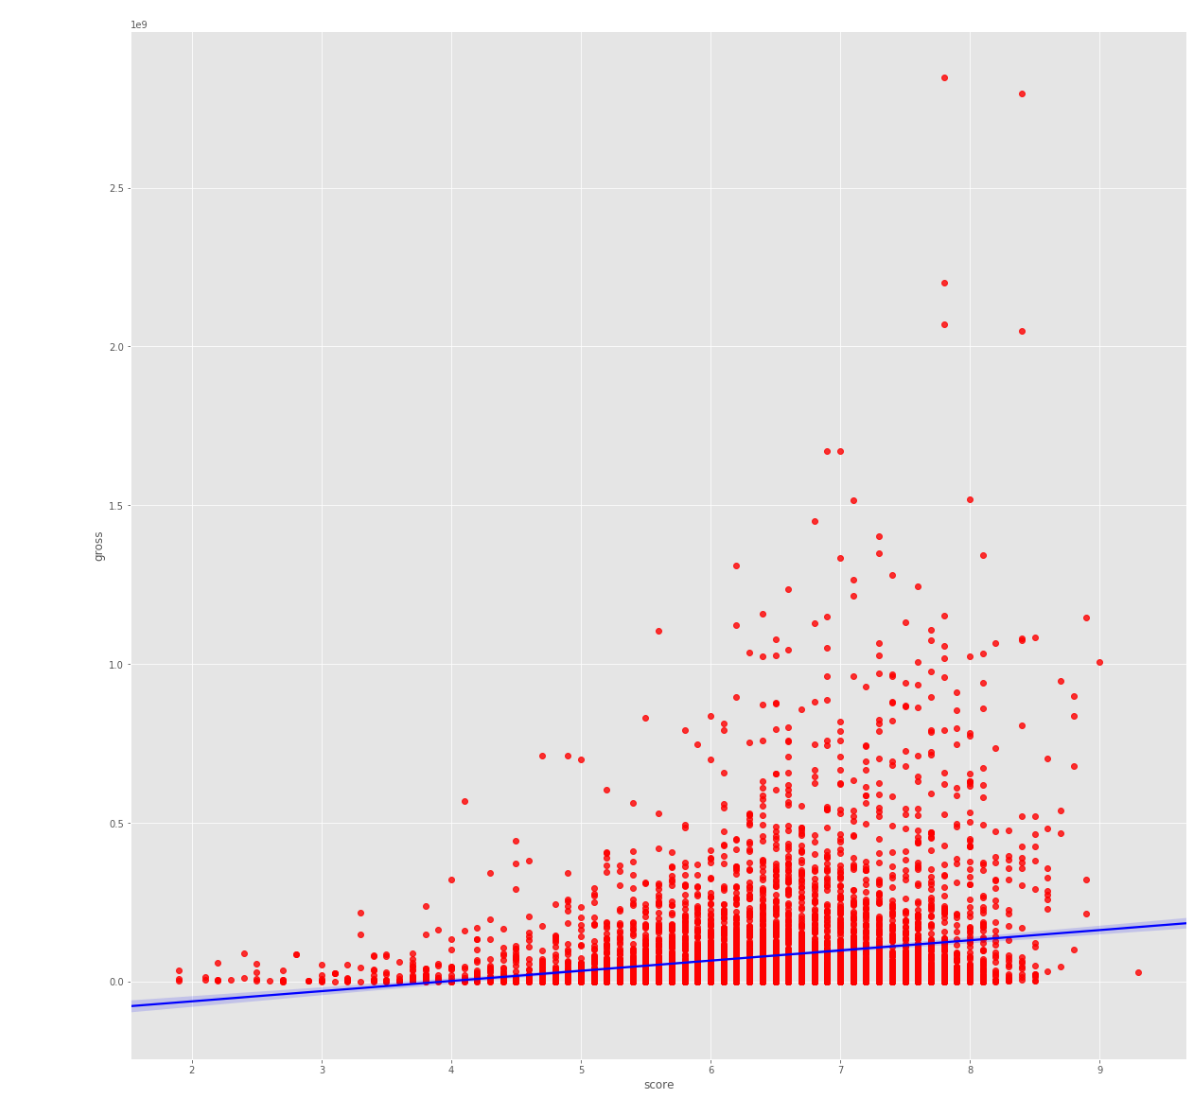
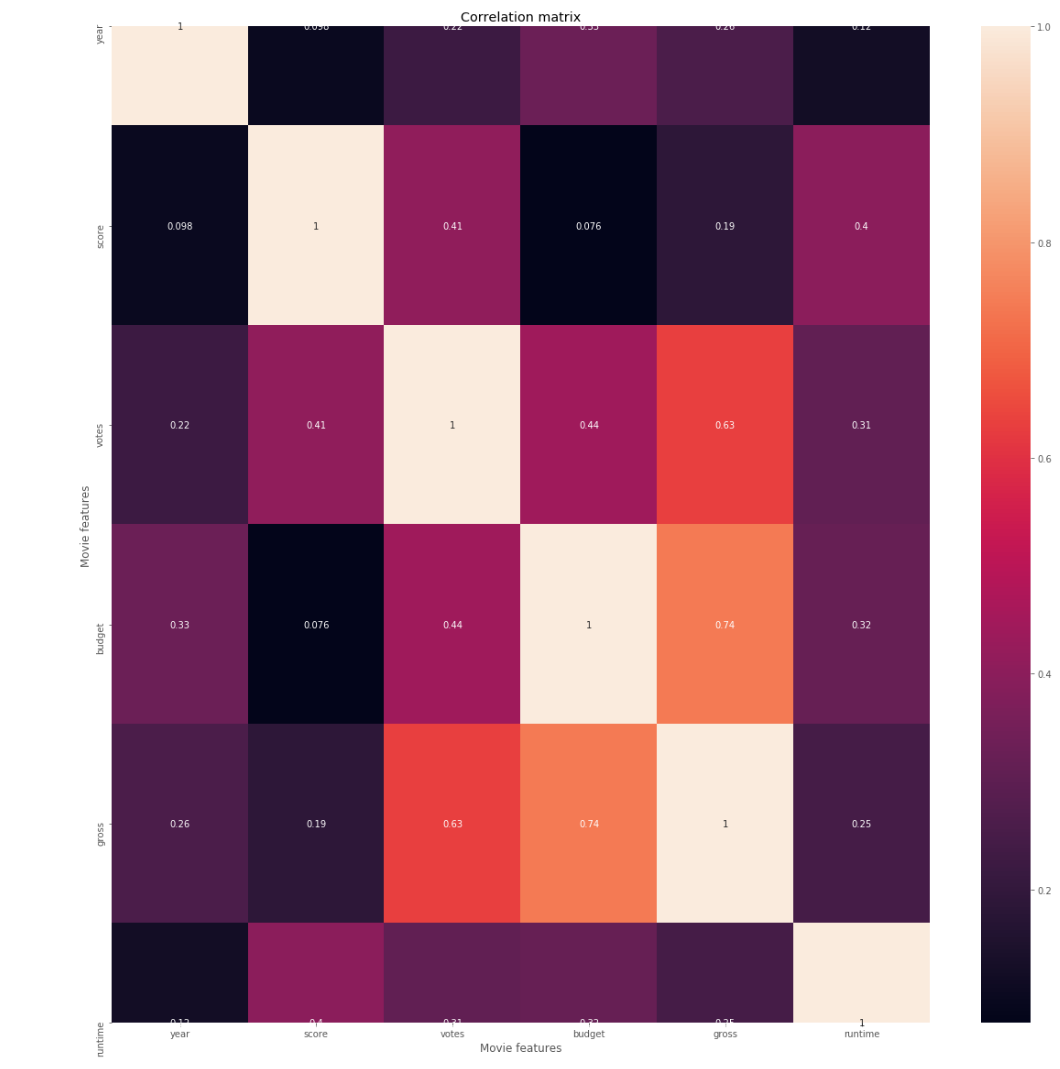
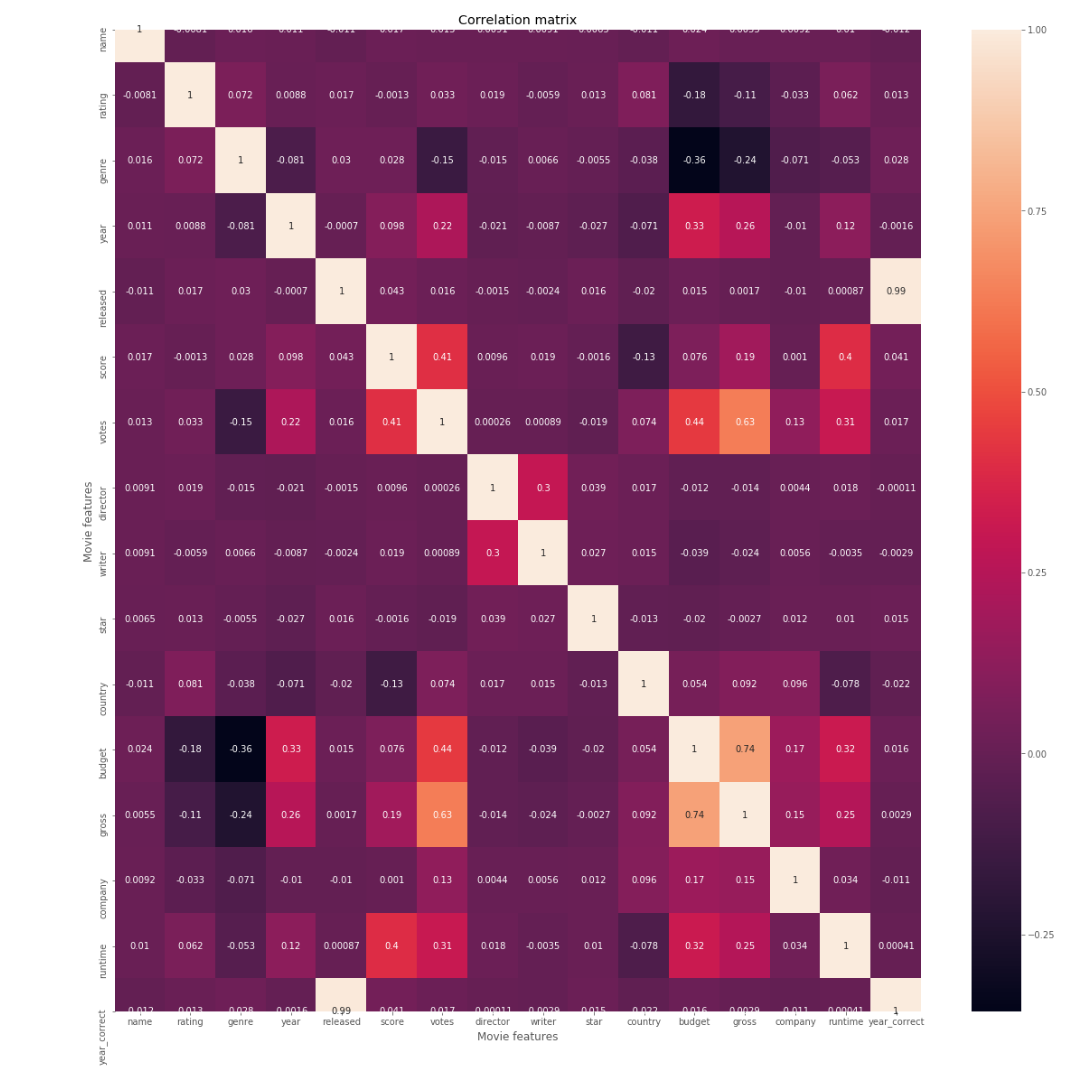
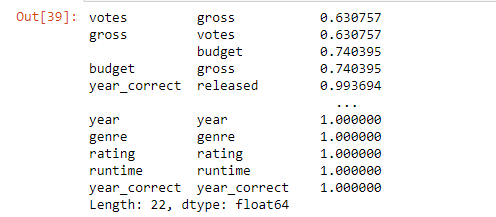
Budget has the strongest positive correlation with gross revenue. Vote count came in as the second-highest predictor — initially surprising, but logical: the more people who see a film, the more votes it accumulates on review platforms.
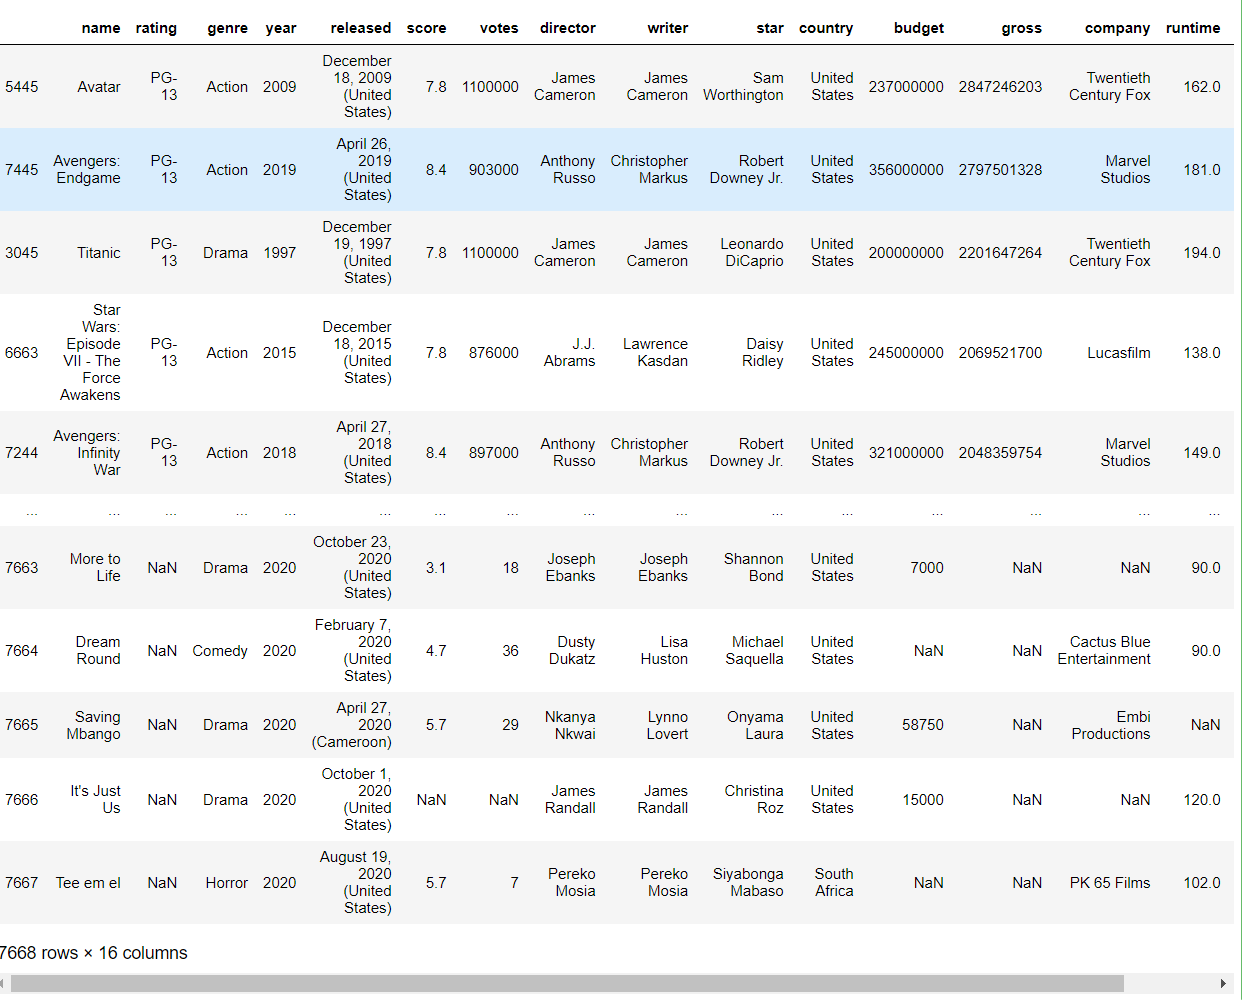
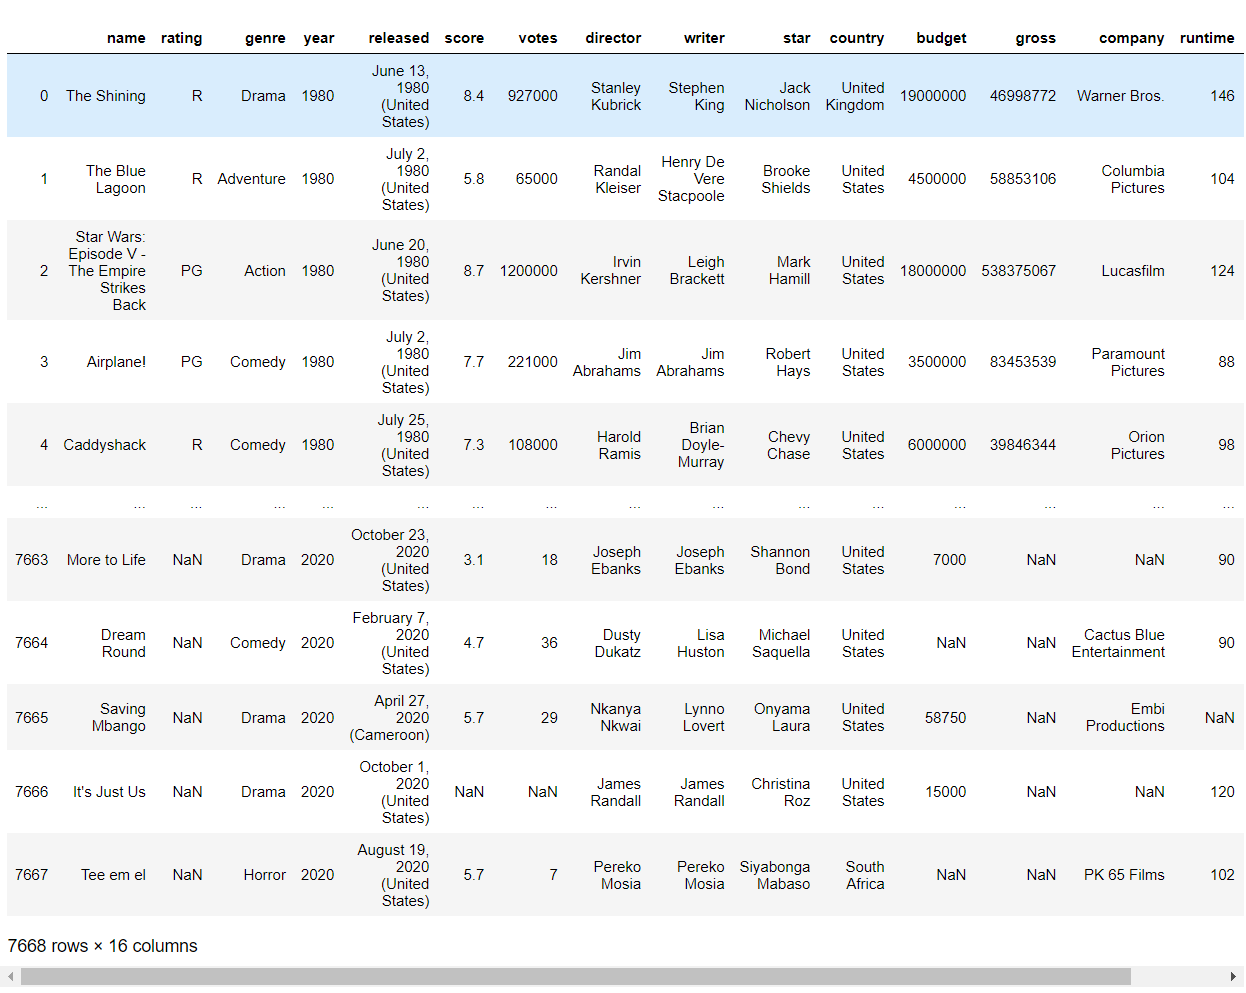
Dataset
Sorted by Gross Revenue
Correlation Analysis
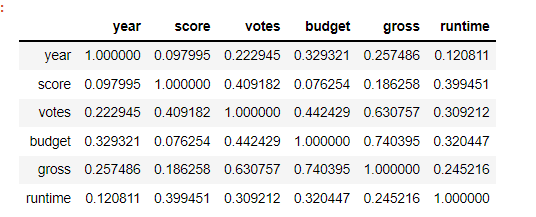
Correlation Matrix
Tech Stack
| Layer | Technology |
|---|---|
| Language | Python |
| Environment | Jupyter Notebook |
| Data manipulation | Pandas, NumPy |
| Visualisation | Seaborn, Matplotlib |
| Data source | Kaggle — danielgrijalvas/movies |
Methodology
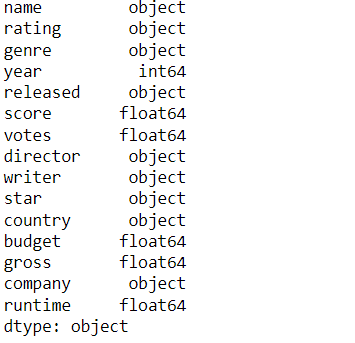
- Import & inspect — loaded CSV, checked shape, dtypes, and null counts
- Clean — converted float columns to integers where appropriate, handled missing values
- Explore — sorted by gross revenue to surface top performers
- Correlate — generated numeric correlation matrix, then encoded categorical variables for inclusion
- Visualise — scatter plots with trend lines, regression plots, correlation heatmap
Key Skills Demonstrated
- End-to-end exploratory data analysis workflow in Python
- Statistical correlation analysis with proper handling of categorical variables
- Data cleaning and type normalisation with Pandas
- Clear visual communication of statistical findings with Seaborn/Matplotlib