A self-initiated project to gain a clearer picture of my own daily activity patterns — breaking down step counts by exercise type (running vs walking) with automated daily updates and trend analysis.
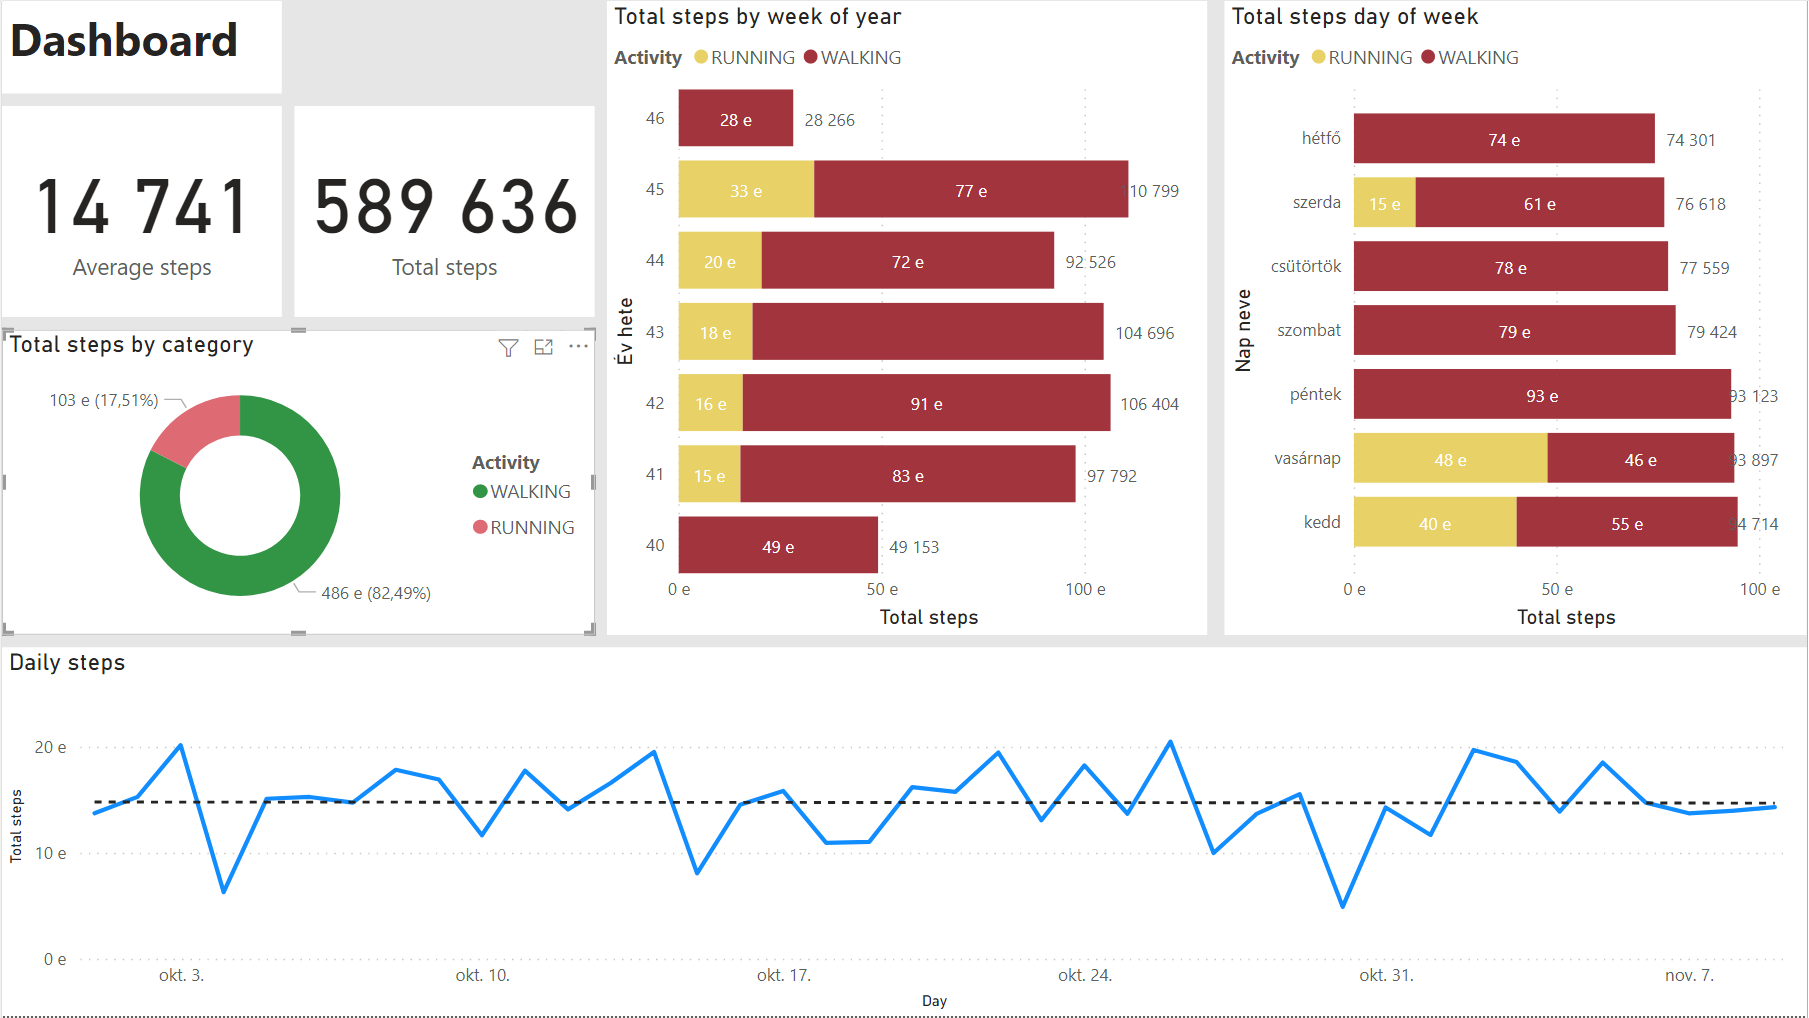
Dashboard

Data Model
Dimension Tables
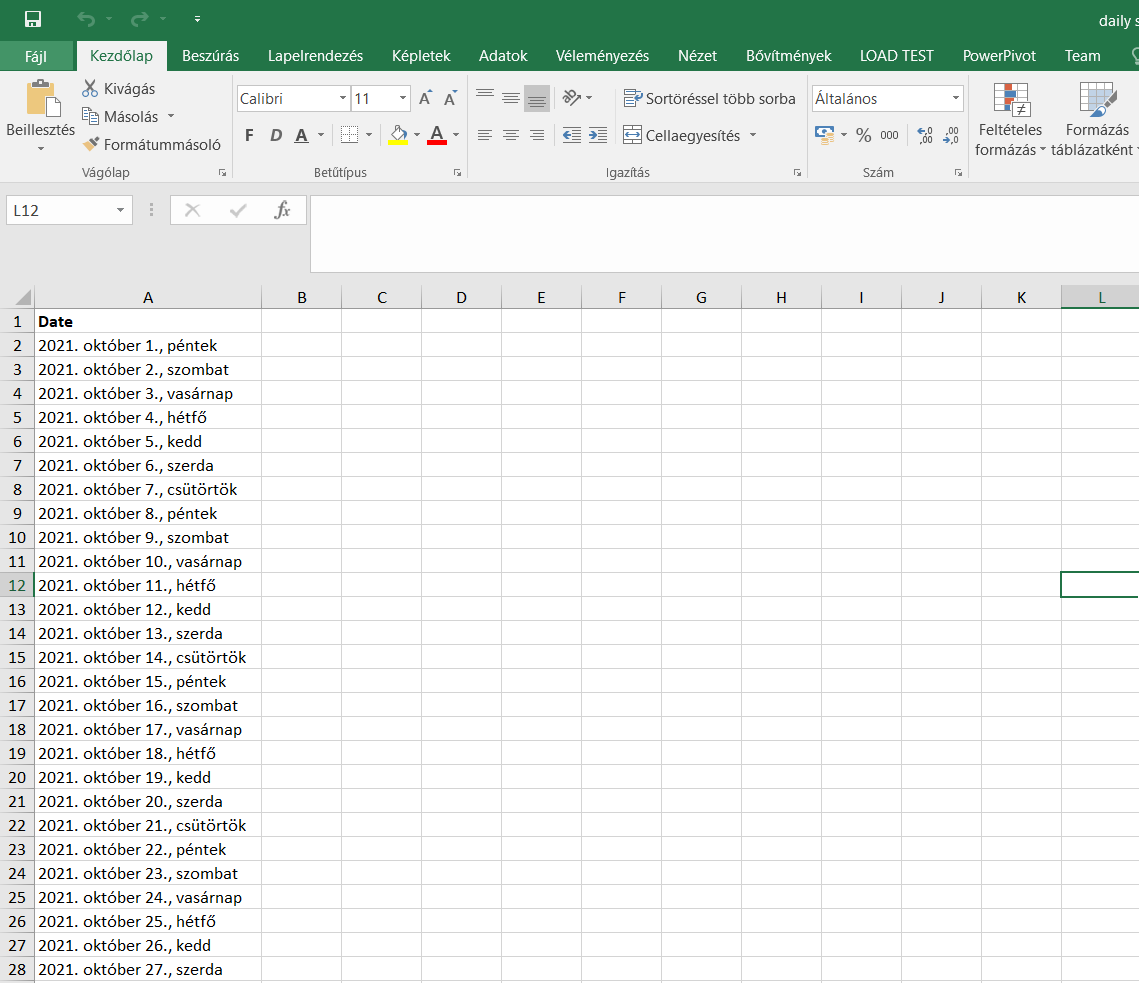
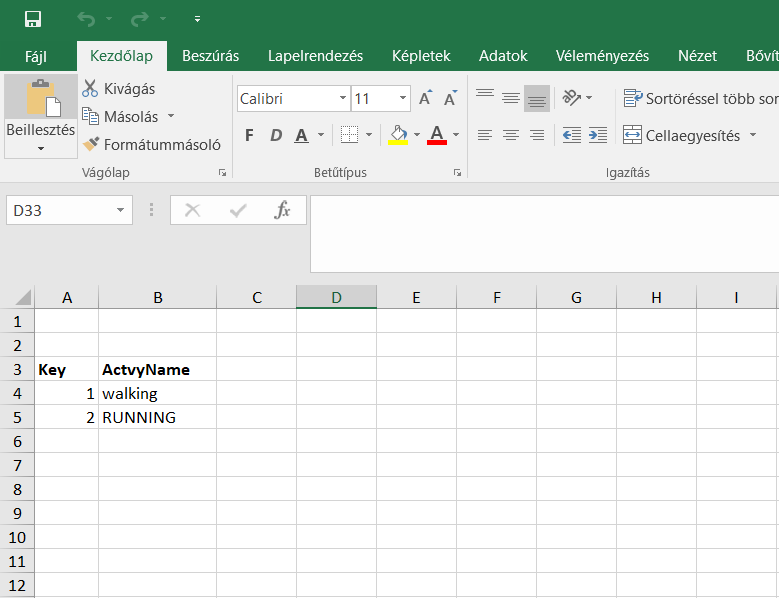
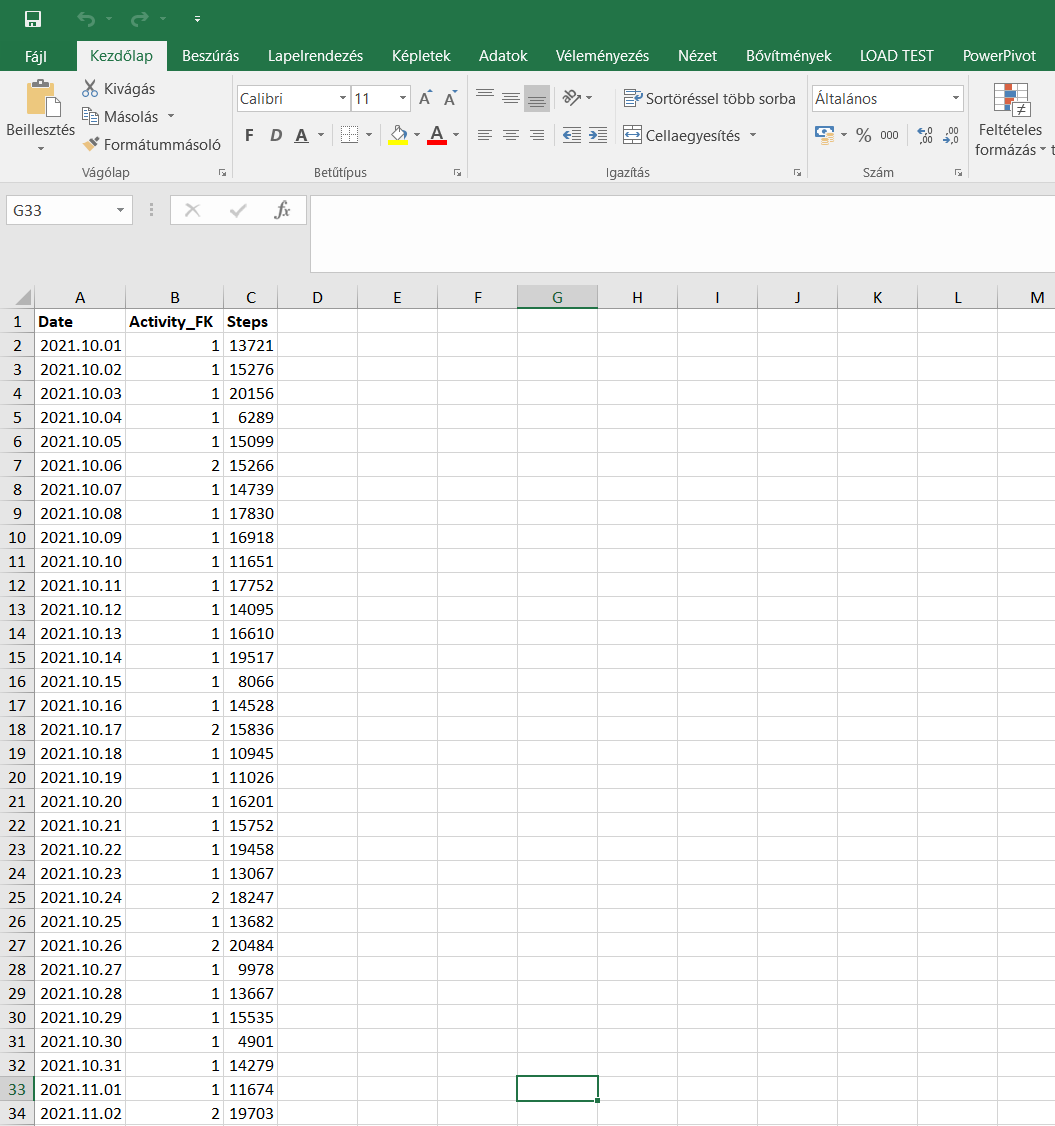
Source Data (Excel)
What it does
- Tracks total daily steps over time
- Splits activity into running and walking categories
- Shows averages, totals, cumulative steps, and percentage breakdowns
- Filters by day of week, month, and activity type
Tech Stack
| Layer | Technology |
|---|---|
| Data entry | Excel |
| Transformation | Power Query (Power BI) |
| Calculations | DAX |
| Visualisation | Power BI Dashboard |
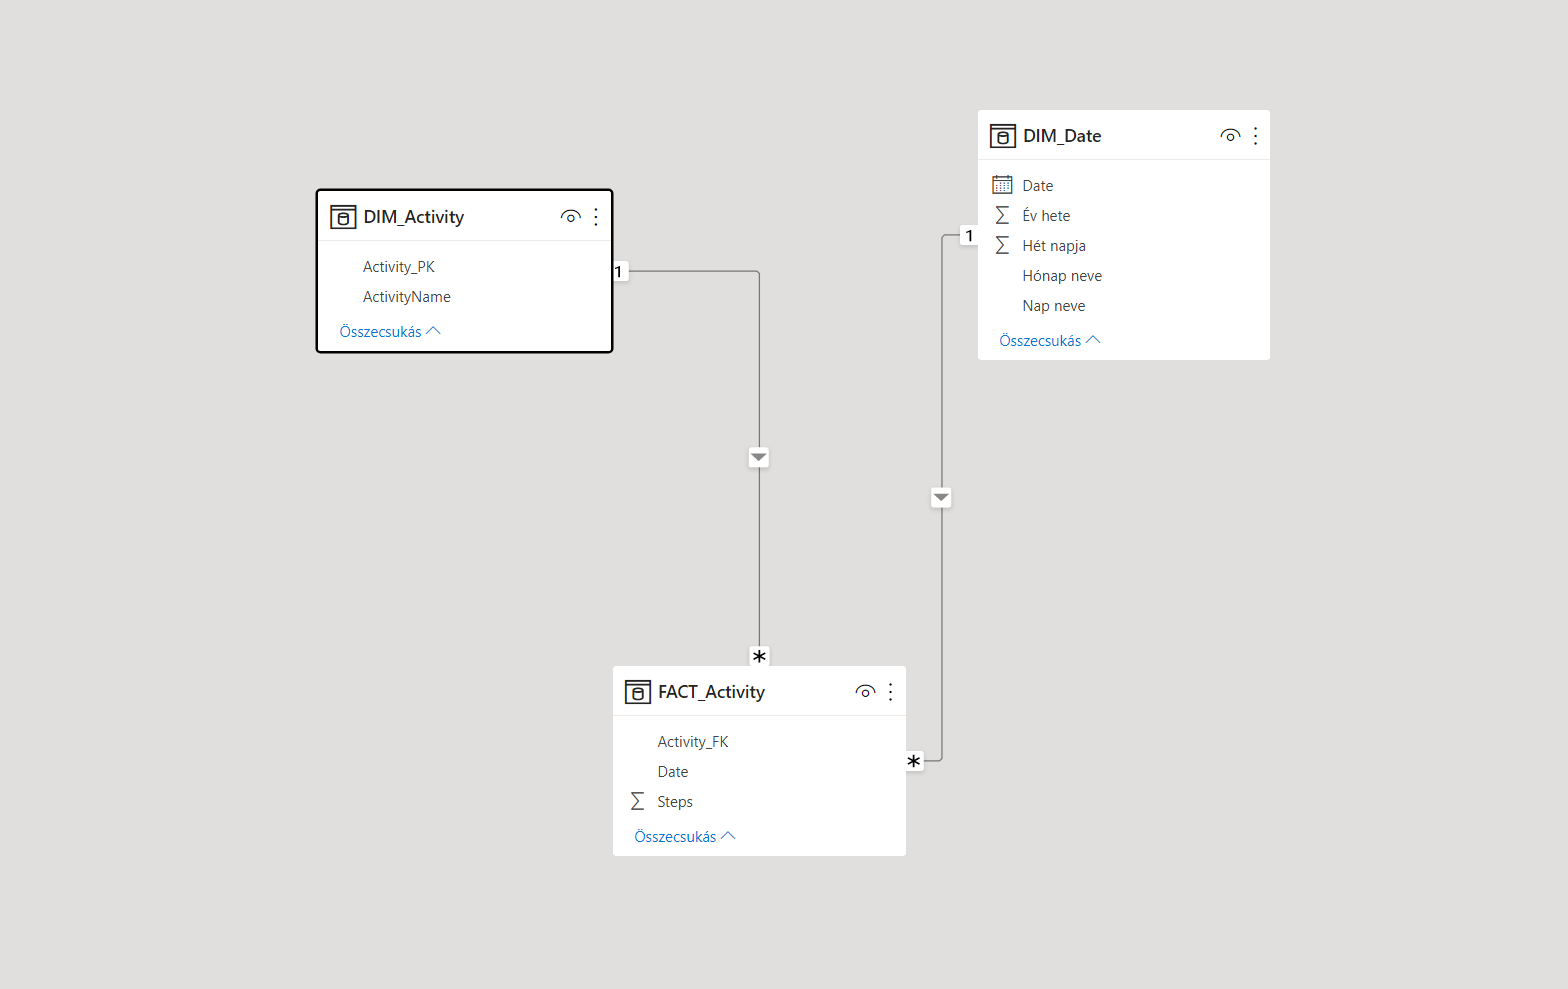
Data Model
Built a proper dimensional model for what is essentially a personal dataset:
- FACT_exercise — daily step counts, linked to date and activity type via foreign keys
- DIM_Date — calendar dimension with derived columns: day name, month name, day of week number, week number
- DIM_Activity — activity type dimension (Running / Walking)
DAX Measures
- Total steps
- Average daily steps
- Running steps total
- Walking steps total
- Running % / Walking %
- Cumulative step count
Key Skills Demonstrated
- Designing a normalised data model from scratch for a personal dataset
- Writing DAX measures for aggregation, ratios, and running totals
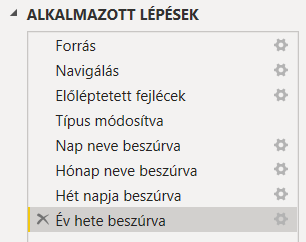
- Power Query data transformation: header promotion, type standardisation, column pruning
- Building a clean, filterable dashboard for time-series personal data